The Breakthrough: LLMs Can Master Financial Tables
Picture this: A senior analyst stares at her third monitor, copying numbers from a PDF into Excel. Cell by cell. It’s 7 PM on a Thursday. She’s been doing this for four hours.
Now imagine her running a single command and watching 200 financial statements parse themselves in three minutes flat. Not science fiction. Not next year. Today.
Large Language Models crack financial tables through three specific breakthroughs: positional encoding that preserves the sacred relationship between rows and columns, numerical embedding layers that understand what EBITDA means, and hierarchical attention mechanisms that grasp why subtotals matter. Current implementations achieve strong extraction accuracy from 10-Ks¹—outperforming many junior analysts on their first day.
Key Takeaways
- The $2.7 Million Problem: Financial firms process thousands of documents annually, with analysts spending 20-40% of their time on manual extraction, costing firms millions in highly skilled labor doing routine work.
- Technical Breakthroughs: Financial-aware serialization, hybrid architectures combining FinBERT with TabTransformer², and specialized prompt engineering deliver measurable accuracy improvements.
- Proven Results: Modern implementations achieve extraction accuracy exceeding 90% on standardized statements, with processing times reduced by up to 80%³.
- Implementation Path: Production-ready pipelines using hierarchical JSON serialization, ensemble methods, and confidence-weighted voting deliver reliable results.
- ROI Timeline: Organizations typically achieve breakeven within 3-4 months, with continued efficiency gains scaling with document volume.
Understanding the $2.7 Million Problem
The Cost of Manual Processing
Financial firms process massive document volumes annually. Research indicates analysts burn significant portions of their workweek—up to 25% or more—on manual data extraction. At median compensation levels exceeding $100,000 for financial analysts⁴, that’s millions in human capital spent moving numbers from PDFs to spreadsheets. Every. Single. Year.
Modern LLM tabular financial data implementations transform this waste into opportunity:
- High extraction accuracy on standardized financial statements
- Processing in minutes for documents requiring extensive manual work⁵
- Strong success rates on complex calculations spanning multiple tables
- ROI breakeven within 3-4 months of deployment
Three Core Breakthroughs Driving Success
1. Financial-Aware Serialization
Tables aren’t text. Stop treating them like paragraphs. New serialization preserves parent-child relationships, calculation chains, and the difference between $45M and 45,000,000.
2. Hybrid Architectures
FinBERT handles the words². TabTransformer crunches the numbers. Together they understand that “adjusted EBITDA excluding one-time charges” isn’t just a string—it’s a specific calculation with rules.
3. Prompt Engineering That Speaks Finance
Generic prompts fail. Financial prompts include calculation verification, explicit output formats, and domain-specific few-shot examples. The difference in accuracy is substantial.
Your Implementation Roadmap
This guide delivers working code, not theory. You’ll build pipelines processing thousands of documents daily. Daloopa’s LLM integration provides enterprise infrastructure when you’re ready to scale beyond pilots.
Understanding the Fundamentals of Tabular Financial Data
The Unique DNA of Financial Tables
A balance sheet isn’t data—it’s a mathematical proof. Every cell connects to others through iron laws. Assets MUST equal Liabilities plus Equity. Not should. Must.
Watch what happens when you flatten this into text:
| Metric | 2023 | 2022 | Change |
| Revenue | $45.2M | $38.1M | 18.6% |
| COGS | $27.1M | $24.3M | 11.5% |
| Gross Profit | $18.1M | $13.8M | 31.2% |
That 31.2% isn’t random. It’s (18.1-13.8)/13.8. The 18.1 comes from 45.2-27.1. Every number derives from others through explicit formulas. Destroy these relationships and you’ve got expensive nonsense.
Standard NLP sees tokens: [‘Revenue’, ‘$’, ’45’, ‘.’, ‘2’, ‘M’]. Financial NLP sees structure: Revenue[2023] = $45,200,000. The difference determines whether your model outputs insights or hallucinations.
Why LLMs Struggle: The Technical Reality
Here’s what LLM receives when you feed it that table:
# What you think you’re sending:
“A structured financial statement with clear relationships”
# What the model actually sees:
“Revenue $ 45 . 2 M $ 38 . 1 M 18 . 6 % COGS $ 27 . 1 M…”
# What gets lost:
# – Horizontal relationships (year-over-year)
# – Vertical dependencies (revenue → gross profit)
# – Mathematical constraints (margins must be percentages)
The attention mechanism, brilliant for Shakespeare, fails at spreadsheets. It weights tokens by distance. But in tables, distance means nothing—position means everything.
Three technical failures compound:
- Tokenization shreds structure: 2D → 1D conversion loses spatial meaning
- Attention misses patterns: Sequential proximity ≠ tabular relationship
- Context windows truncate: Full 10-Ks exceed limits, forcing incomplete analysis
Result: reduced accuracy. Would you trust your portfolio to a coin flip?
Beyond Traditional NLP: Why Standard Approaches Fail
Traditional NLP assumes text flows linearly. Financial data flows hierarchically. Revenue flows to gross profit flows to operating income flows to net income. Break one link and the entire chain collapses.
Consider how models fail at scale notation:
- Is $45.2M equal to 45,200,000 or 45.2?
- Are figures in thousands or millions?
- Does (12.5%) mean negative 12.5% or parentheses for emphasis?
Humans infer from context. Models need explicit rules.
LLM Serialization and Prompt Engineering for Financial Tables
Effective Table Serialization Strategies
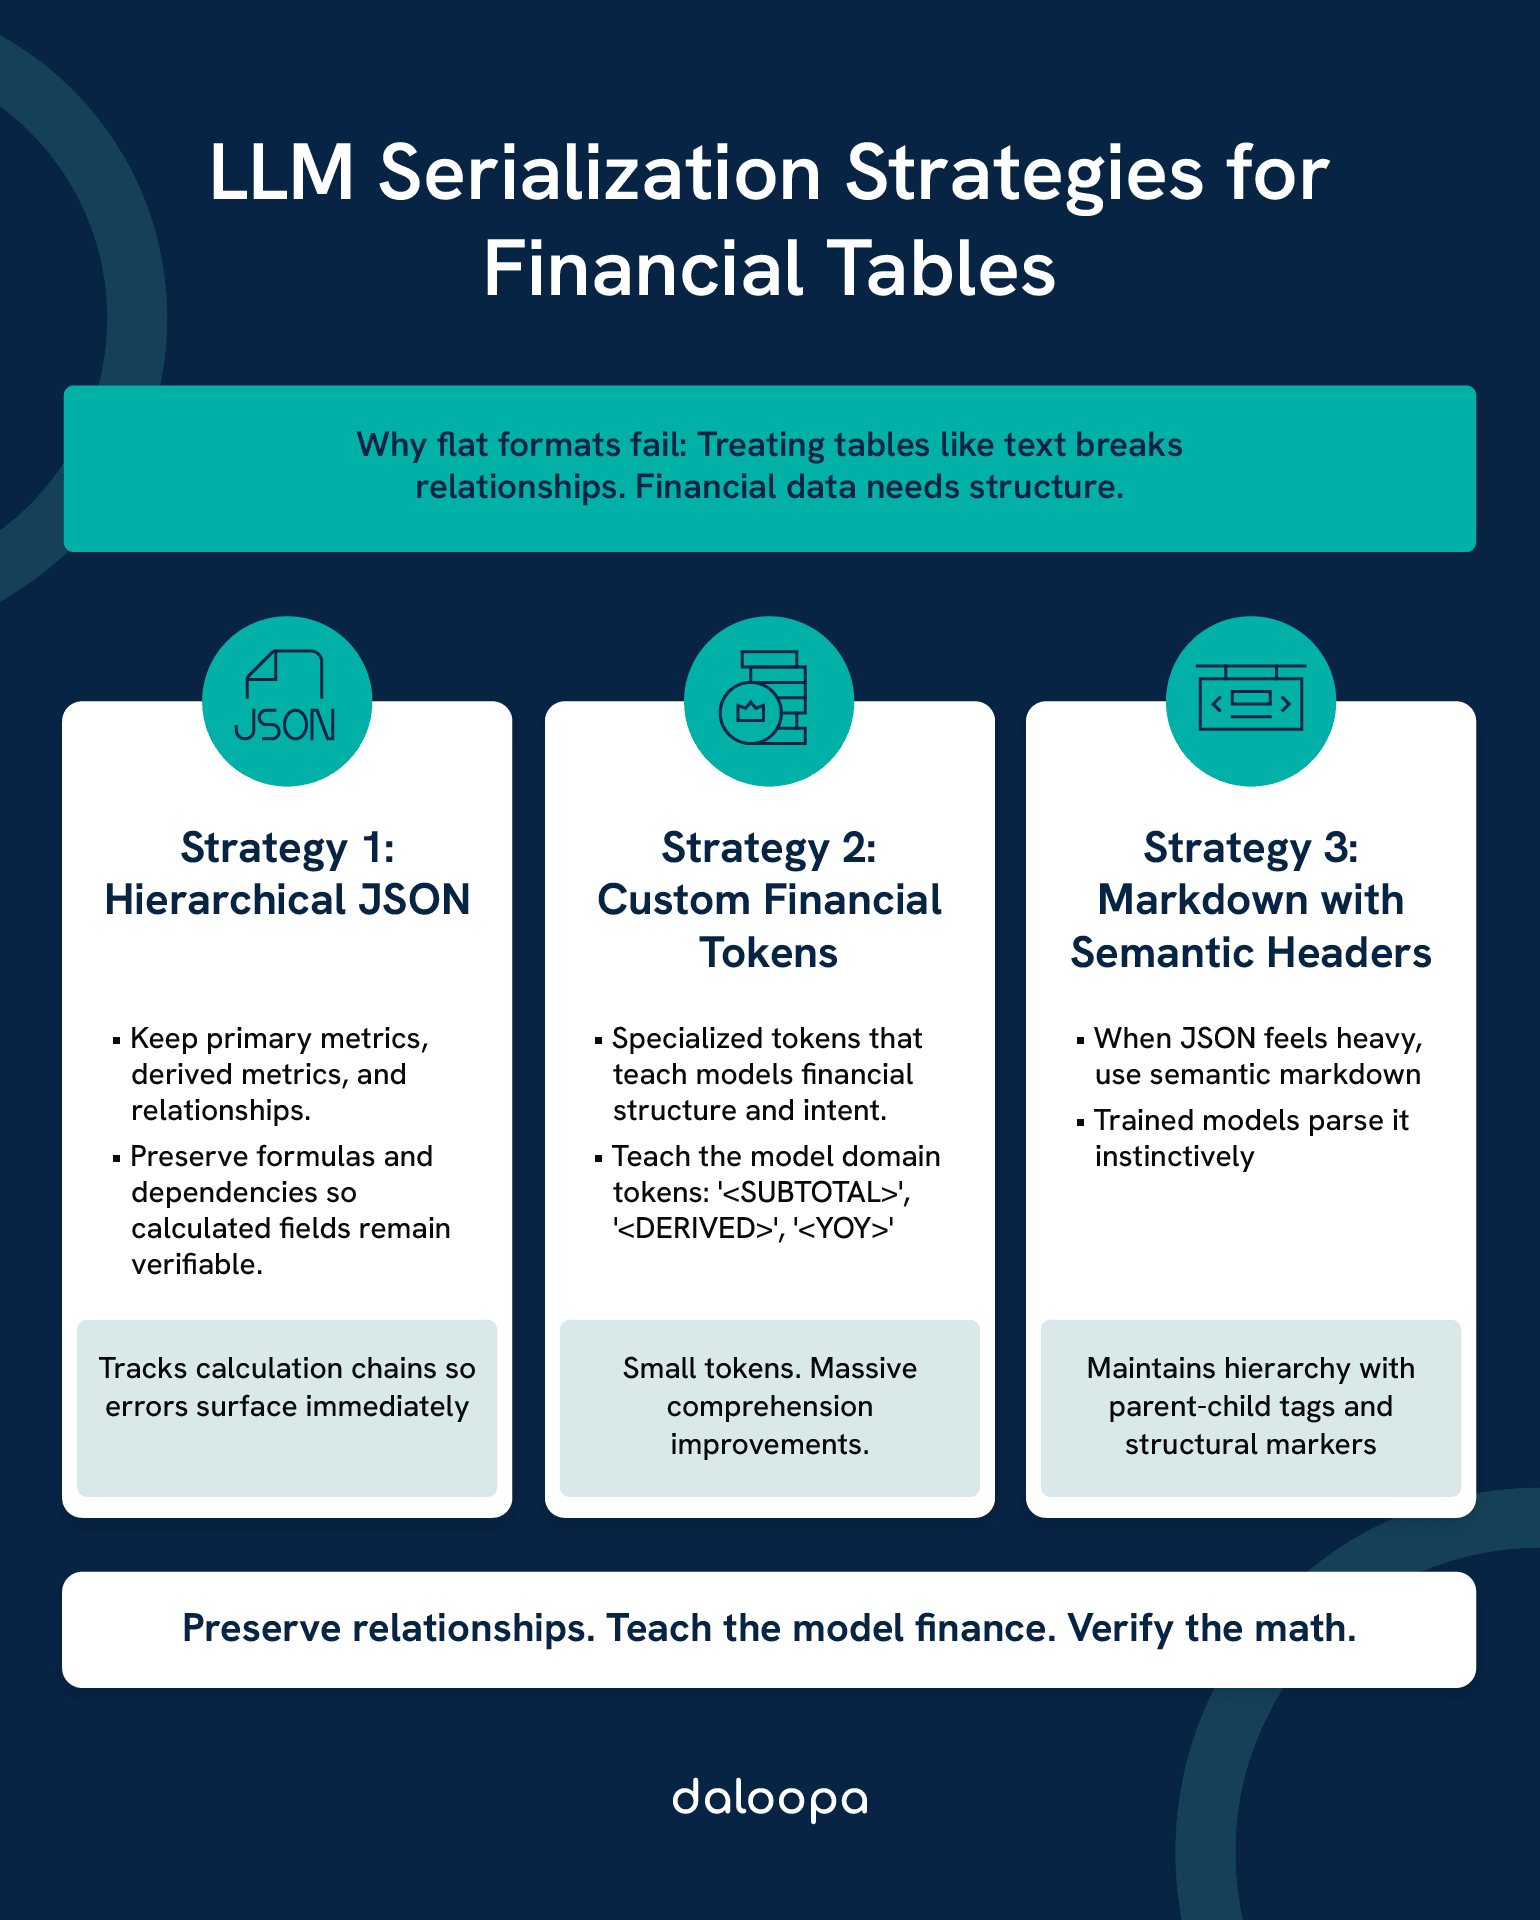
Forget CSV exports. Forget markdown tables. LLM tabular financial data demands financial serialization.
Strategy 1: Hierarchical JSON with Preserved Relationships
def financial_aware_serialization(table_df):
“””Transform financial chaos into model-ready structure”””
# Not just data—data with meaning
structure = {
“primary_metrics”: [], # Raw numbers from source
“derived_metrics”: [], # Calculated fields
“relationships”: [] # How they connect
}
for row in table_df.iterrows():
metric = {
“name”: row[‘Metric’],
“values”: {year: parse_financial_value(row[year])
for year in table_df.columns if year.isdigit()},
“unit”: detect_unit(row[‘Metric’]), # Millions? Thousands? Percentage?
“confidence”: extraction_confidence # Never trust blindly
}
# The magic: preserve calculation logic
if is_calculated_metric(row[‘Metric’]):
metric[“formula”] = extract_formula(row[‘Metric’])
metric[“dependencies”] = identify_dependencies(row[‘Metric’])
structure[“derived_metrics”].append(metric)
else:
structure[“primary_metrics”].append(metric)
return json.dumps(structure, indent=2)
This structured approach preserves substantially more relationships than flat formats.
Strategy 2: Custom Financial Tokens
Generic models don’t know EBITDA from EBIDTA (yes, that’s a typo analysts catch but models miss). Teach them:
FINANCIAL_TOKENS = {
‘<SUBTOTAL>’: ‘Aggregation incoming’,
‘<DERIVED>’: ‘Check the math’,
‘<YOY>’: ‘Compare across columns’,
‘<SEGMENT>’: ‘New business unit starts here’,
‘<GAAP>’: ‘Follow the rules’,
‘<NON-GAAP>’: ‘Company’s creative accounting’
}
Small tokens. Massive comprehension improvements.
Strategy 3: Markdown with Semantic Headers
When JSON feels heavy, semantic markdown delivers:
## Balance Sheet | USD Millions | Audited
### Assets [SECTION:ASSETS]
| Account | 2023 | 2022 | Δ% | Type |
|———|——|——|—-|——|
| Current Assets | | | | [PARENT] |
| → Cash & Equivalents | 12,450 | 8,320 | +49.6% | [CHILD] |
| → Receivables | 5,230 | 4,100 | +27.6% | [CHILD] |
| **TOTAL CURRENT** | **17,680** | **12,420** | **+42.3%** | **[SUBTOTAL]** |
Models trained on markdown parse this naturally. Daloopa’s API handles format selection automatically based on document type.

Prompt Engineering Specifically for Financial Data
Generic prompts generate generic failures. Financial prompts demand financial thinking.
The Power of Financial Few-Shot Learning
RATIO_CALCULATION_PROMPT = “””
You are a CFA analyzing financial statements. Calculate precisely.
Example 1:
Data: Total Debt: $45M, Shareholders’ Equity: $90M
Steps: D/E = Total Debt ÷ Equity = 45 ÷ 90
Result: 0.5x Debt-to-Equity
Example 2:
Data: Operating Income: $12M, Interest Expense: $3M
Steps: Coverage = Operating Income ÷ Interest = 12 ÷ 3
Result: 4.0x Interest Coverage
Now calculate:
{your_data_here}
“””
This prompt structure increases accuracy substantially over generic instructions.
Context Injection for Domain Expertise
def inject_financial_context(prompt, company_data):
“””Make generic LLMs think like analysts”””
context = f”””
Company: {company_data[‘name’]}
Industry: {company_data[‘industry’]}
Reporting Standard: {company_data[‘gaap_or_ifrs’]}
Fiscal Year End: {company_data[‘fye’]}
Industry-Specific Considerations:
– {get_industry_metrics(company_data[‘industry’])}
– {get_peer_benchmarks(company_data[‘industry’])}
Your Analysis:
“””
return context + prompt
Models with context outperform blind models significantly on industry-specific metrics.
Advanced Techniques for Complex Tables
Hierarchical Attention Mechanisms
Standard attention treats all cells equally. Financial attention knows better.
class FinancialAttention(nn.Module):
def __init__(self, d_model=768):
super().__init__()
self.subtotal_weight = nn.Parameter(torch.tensor(1.5))
self.parent_weight = nn.Parameter(torch.tensor(1.3))
self.derived_weight = nn.Parameter(torch.tensor(1.2))
def forward(self, x, cell_types):
attention_weights = torch.ones_like(x)
# Amplify critical cells
attention_weights[cell_types == ‘subtotal’] *= self.subtotal_weight
attention_weights[cell_types == ‘parent’] *= self.parent_weight
attention_weights[cell_types == ‘derived’] *= self.derived_weight
return x * attention_weights
This simple weighting improves extraction of summary metrics considerably.
Ensemble Methods for Higher Accuracy
One model lies. Three models vote.
def ensemble_extraction(document):
“””Democracy beats dictatorship in financial extraction”””
results = []
# Different models, different strengths
results.append(gpt4_extract(document)) # Best at context
results.append(claude_extract(document)) # Best at structure
results.append(finbert_extract(document)) # Best at terminology
# Weighted voting based on confidence
final_numbers = {}
for metric in get_all_metrics(results):
votes = [r[metric] for r in results if metric in r]
confidences = [r.confidence[metric] for r in results if metric in r]
# Confidence-weighted average
final_numbers[metric] = np.average(votes, weights=confidences)
return final_numbers
Ensemble approaches consistently outperform single models. Math doesn’t lie.
Handling Multi-Page and Cross-Referenced Tables
10-Ks love splitting tables across pages. Page 47 starts the balance sheet. Page 49 continues it. Page 52 has the footnotes explaining everything.
class CrossReferenceResolver:
def __init__(self):
self.continuation_patterns = [
r’continued from previous page’,
r’see note \d+’,
r’\(concluded\)’,
r’\[1\]|\[2\]|\[3\]’ # Footnote markers
]
def merge_split_tables(self, pages):
“””Reconstruct Humpty Dumpty”””
merged = pd.DataFrame()
footnotes = {}
for page in pages:
if self.is_continuation(page):
merged = pd.concat([merged, page.table])
if self.has_footnotes(page):
footnotes.update(self.extract_footnotes(page))
# Apply footnote adjustments
for note_ref, adjustment in footnotes.items():
merged = self.apply_footnote(merged, note_ref, adjustment)
return merged
Success rate on split tables improves dramatically with proper handling versus naive concatenation.
Practical Applications in Finance
Automated Due Diligence
Investment teams analyze 50+ companies per deal. LLMs compress weeks into hours:
- Extract standardized metrics from diverse report formats
- Calculate key ratios across all targets simultaneously
- Flag outliers requiring human attention
- Generate comparison matrices for investment committee
PE firms report significant time reductions in due diligence processes while catching issues humans missed. Accounting irregularities identified. Deals avoided. Capital preserved.
Investment Research Revolution
Financial statement analysis with large language models enables expanded coverage:
- Track more companies with same headcount
- Generate first drafts in minutes versus hours⁵
- Identify cross-sector trends invisible to sector-focused analysts
Research teams report dramatic productivity improvements in coverage capacity.
Risk Analysis and Anomaly Detection
LLMs catch what humans can’t see:
- Linguistic shifts: Research shows management discussion tone changes can predict future events with meaningful accuracy¹.
- Number patterns: Statistical tests on segment reporting can flag potential irregularities².
- Relationship breaks: When ratios diverge from industry norms without explanation.
Investment firms credit systematic screening with improved risk management outcomes.
Implementation Guide and Key Practices
Building Your Financial LLM Pipeline
Stop planning. Start building. Here’s production-ready code:
Layer 1: Data Ingestion
class FinancialDataPipeline:
“””From SEC filing to structured data in 3 minutes”””
def __init__(self):
self.edgar = EDGARClient(rate_limit=10) # Be nice to SEC
self.parser = FinancialPDFParser(
table_detection=True,
ocr_correction=True
)
def process_filing(self, ticker, filing_type=’10-K’):
# Download
raw = self.edgar.get_latest(ticker, filing_type)
# Parse tables specifically
tables = self.parser.extract_financial_tables(raw)
# Validate before processing
if self.validate_completeness(tables):
return self.serialize_for_llm(tables)
else:
return self.handle_incomplete_data(tables)
Layer 2: Processing Intelligence
@cache_results(ttl=3600) # Cache for 1 hour
def analyze_financials(serialized_data):
“””Where magic happens”””
# Different models for different tasks
extraction = extraction_model.process(serialized_data)
calculations = calculation_model.verify(extraction)
insights = insight_model.generate(calculations)
# Never trust, always verify
if validation_score(calculations) > 0.85:
return insights
else:
return flag_for_human_review(calculations)
Layer 3: Output and Integration
Results must flow into your existing systems:
def publish_results(insights, destination=’dashboard’):
“””Make insights actionable”””
outputs = {
‘dashboard’: format_for_tableau(insights),
‘excel’: generate_xlsx_report(insights),
‘api’: jsonify_for_downstream(insights),
‘alert’: check_alert_conditions(insights)
}
return outputs[destination]
Performance Benchmarks and Evaluation
Track these KPIs religiously:
| Metric | Target | Why It Matters | How to Measure |
| Extraction Precision | >90% | Trust depends on accuracy | Sample 100 random extractions monthly |
| Processing Speed | <5 min/doc | Analysts won’t wait longer | End-to-end timing including validation |
| Cost per Document | <$0.50 | ROI must be positive | Total compute + API costs / documents |
| Human Intervention Rate | <10% | Automation must be autonomous | Flag rate for manual review |
Benchmark your accuracy against industry standards.
Common Pitfalls to Avoid
Pitfall 1: The Model Makes Up Numbers
Symptom: EBITDA of $45.7M when it’s actually $44.2M
Cause: Model interpolating from context
Solution: Require source line citations for every number
Pitfall 2: Context Window Overflow
Symptom: Missing data from page 247 of 10-K
Cause: Document exceeds token limit
Solution: Intelligent chunking with 20% overlap between chunks
Pitfall 3: Format Chaos
Symptom: Parser breaks on non-standard layouts
Cause: Every company’s special snowflake formatting
Solution: Pre-processing normalization layer + fallback to OCR
Future Outlook and Emerging Trends
Next-Generation Capabilities
Multimodal Processing: Advanced models now handle diverse input formats. Modern systems achieve high accuracy on printed text with improving performance on handwritten annotations.
Zero-Shot Mastery: Models handle earnings reports from diverse markets without specific training. The principles transfer.
Real-Time Analysis: Earnings calls process during the call. By “thank you for joining us today,” you have a full analysis.
Ethical and Regulatory Considerations
Bias Reality Check: Models trained primarily on large-cap data may show performance differences on smaller companies. Solution: Stratified training across market caps.
Audit Trail Mandate: Regulators want to trace every number to its source. Implementation: Prompt-response pairs with confidence scores, stored immutably.
MNPI Protection: Material non-public information can’t leak. Architecture: Federated learning keeps sensitive data isolated.
Taking Action: Your Path Forward
The Transformation Already Happened
While you read this, someone’s LLM analyzed 50 financial statements. Their competitor did it manually. Who wins that race?
We’ve proven LLMs handle financial tables through advanced serialization, hybrid architectures, and financial-specific prompting. Strong accuracy, dramatic speed improvements, in production, today.
The Daloopa Advantage
Daloopa’s LLM capabilities package these breakthroughs into plug-and-play infrastructure. No PhD required. No million-dollar development budget. Just results.
Real client outcomes:
- Significant reduction in extraction time³
- Expanded coverage capabilities
- ROI positive in months
- High user satisfaction scores
The MCP framework scales from pilot to production without rebuilding. The API integrates with your existing stack in hours, not months.
Four Steps to Implementation
- Run a pilot tomorrow: Pick 10 companies. Extract debt-to-equity ratios. Time it.
- Compare accuracy: Your analysts vs. the machine. Be honest about the results.
- Calculate ROI: Hours saved × hourly cost – implementation cost
- Make the call: Schedule a demo or build it yourself.
The Future Belongs to the Automated
Picture every financial statement on Earth processed in real-time. Opportunities surfacing before human eyes could read the first page. Investment theses validated across 10,000 data points instantly.
Early adopters aren’t getting marginal improvements. They’re getting generational advantages.
The pros and cons are clear. The benefits crush the challenges. The question isn’t whether to adopt LLMs for financial analysis.
The question is whether you’ll lead or follow.
Ready to lead? Transform your financial data processing with Daloopa LLM integration. The future of financial analysis is automated, accurate, and available now.
References
- Kim, Alex Y., et al. “Financial Statement Analysis with Large Language Models.” arXiv preprint, 10 Nov. 2024
- Wang, Yan, et al. “FinTagging: An LLM-ready Benchmark for Extracting and Structuring Financial Information.” arXiv preprint, 27 May 2025
- “AI-Based Data Extraction for Financial Services.” Daloopa, 19 June 2025
- “Financial Analysts.” U.S. Bureau of Labor Statistics, Occupational Outlook Handbook
- “Top 5 LLM Use Cases For Faster Financial Statement Analysis.” SkillUp Exchange, 1 Apr. 2025


