When comparing two acquisition targets, how do you know which one is truly the better deal?
Relying on ratios like net profit margin, revenue growth, or even P/E alone can give you a skewed picture, one that overlooks how much debt a company carries or how efficiently it operates. That’s where the EV/EBITDA ratio comes in. It combines Enterprise Value, which includes debt and reflects a company’s total value, with EBITDA, a measure of core operating performance before the effects of financing and accounting decisions. This ratio helps assess a company’s value relative to its ability to generate earnings from its core operations, offering insights that equity-only metrics like P/E often miss.
Key Takeaways
- EV/EBITDA gives a broader view than P/E by including debt and highlighting operational performance.
- Key financial metrics comparisons across industry sectors and capital structures help in identifying undervalued businesses with stronger fundamentals.
- Lower EV/EBITDA values can indicate investment opportunities, particularly when paired with solid fundamentals.
Defining EV and EBITDA
EV and EBITDA are central to understanding how much a company is worth and how well it runs. One tells you the overall market value including debt; the other strips down income to its operating core. Together, they drive smarter business valuation analysis.
What Is Enterprise Value (EV)?
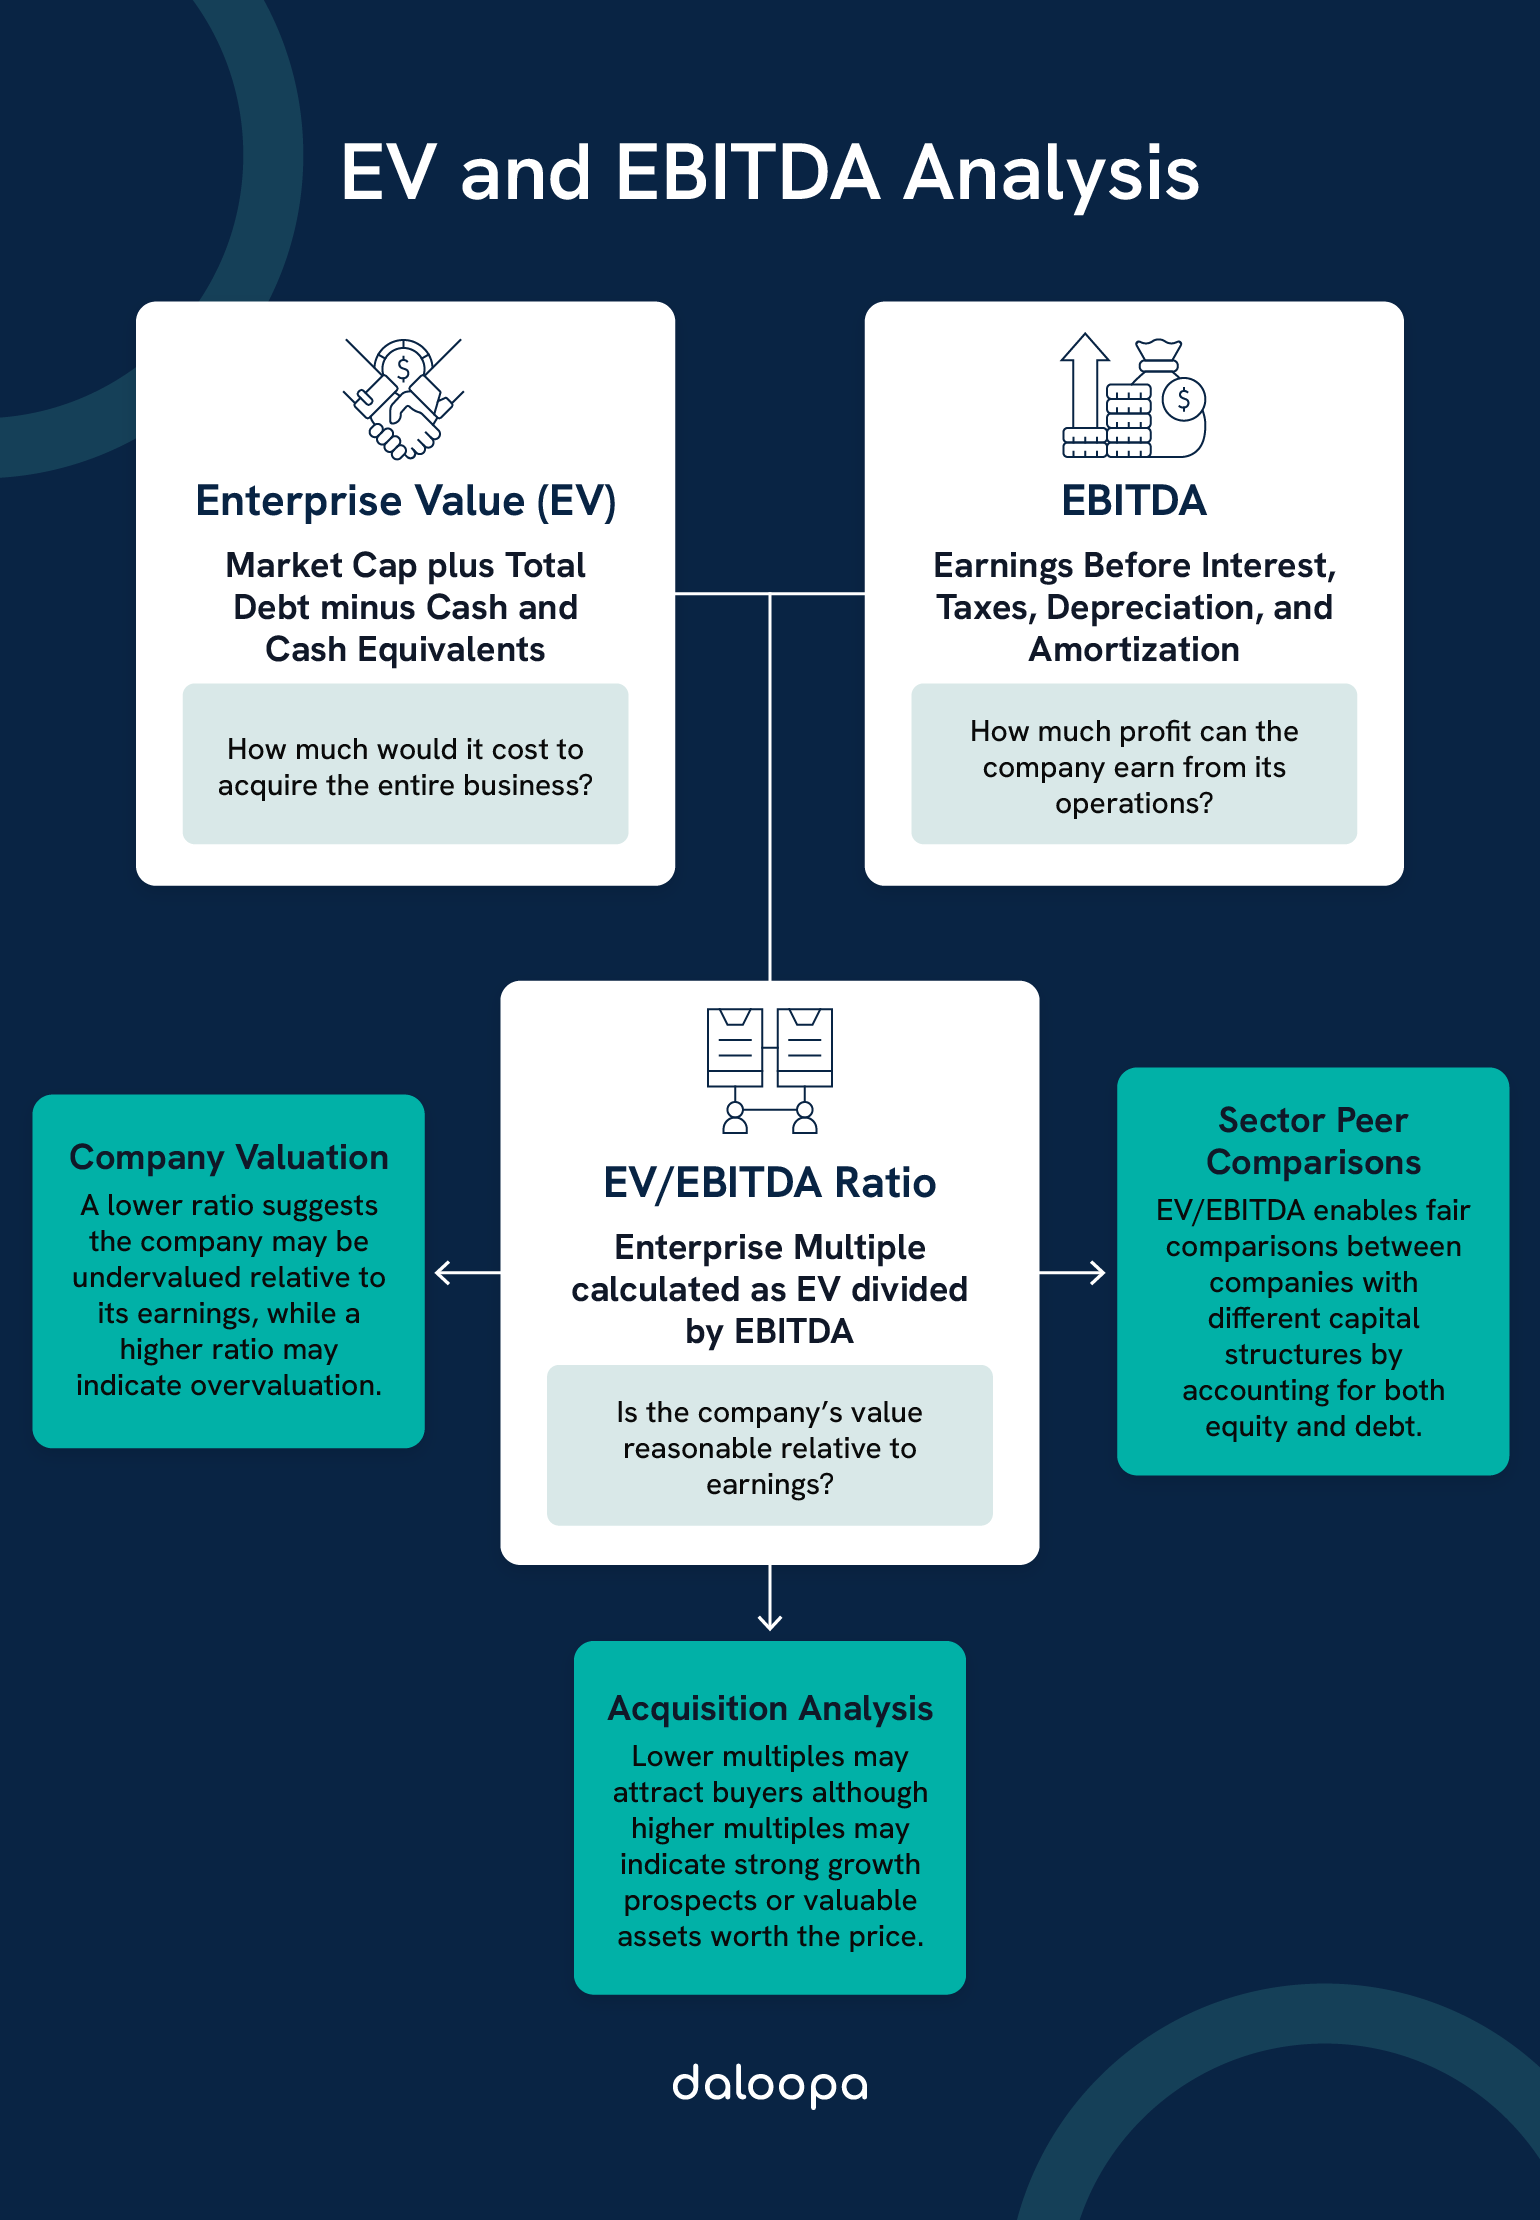
Enterprise Value reflects what it would actually cost to acquire a business. It combines both its market cap and debt, then subtracts cash on hand. The basic idea is to arrive at the net takeover cost.
The standard EV formula is:
EV = Market Cap + Total Debt – Cash and Cash Equivalents
Market cap represents the company’s equity value, calculated by multiplying outstanding shares by the current stock price.
Debt includes short- and long-term borrowings, which any buyer would assume if acquiring the business.
Cash and equivalents reduce the effective cost because they can be used to pay down obligations immediately upon acquisition.
What Is EBITDA?
EBITDA means Earnings Before Interest, Taxes, Depreciation, and Amortization. It reflects a business’s core operational profit before accounting for financing and tax decisions.
To get EBITDA from net income, you add back:
- Interest costs
- Taxes owed
- Depreciation expenses
- Amortization of intangible assets
EBITDA = Net Income + Interest + Taxes + Depreciation + Amortization
By adding these factors, EBITDA shows the operating engine of the business, helping to isolate profitability without capital structure or policy distortions.
EV vs. EBITDA: Conceptual Valuation Metrics Comparison
Think of EV as the total price tag of a company, and EBITDA as the earnings you get in return. Together, they create a ratio that signals whether a company is priced fairly.
EV takes a holistic view, factoring in debt and equity to show the full business value.
EBITDA focuses on earnings from core operations, excluding financing and accounting variables. This makes it ideal for comparing:
- Companies with different leverage
- Firms in various tax brackets
- Businesses using different depreciation methods
For example, imagine two companies, Company A and Company B, each generating $10 million in EBITDA. Company A has an Enterprise Value of $50 million, while Company B’s EV is $100 million. At first glance, their operational performance is identical, but Company B’s higher EV pushes its EV/EBITDA ratio to 10, compared to Company A’s 5. This gap could reflect growth expectations, brand value, or market positioning, but it could also point to higher debt, overvaluation, or investor overconfidence.
That’s where this ratio shines. It helps investors spot not just value but potential risk. Instead of relying on surface-level metrics, EV/EBITDA looks into what a buyer is actually paying for and how long it would take, using operating profits alone, to earn that money back.
You can use it to know when a company might be overvalued or undervalued relative to its peers.

Analytical Applications
EV and EBITDA are important in analysis tools that help investors model scenarios, evaluate trends, and make better-informed decisions. In any business valuation analysis, these metrics help you cut through accounting noise and assess real operational value.
Trend Analysis: EV vs. EBITDA Over Time
Tracking quarterly shifts in EV and EBITDA helps spot patterns in how companies are valued compared to how they perform.
When EBITDA increases faster than EV, it often points to rising efficiency and stronger operating profits. It signals that a business is squeezing more out of its core operations without inflating its valuation.
But when EV climbs while EBITDA holds flat, it may be a sign of heightened investor expectations, hype around expansion plans, or market speculation that may not be backed by fundamentals. These disconnects can uncover overvalued companies riding momentum rather than performance.
Divergences between the two can also highlight changes in capital allocation, working capital adjustments, or long-term investment strategies that aren’t yet reflected in earnings.
Scenario Analysis: Operational Changes
We simulate how operational shifts affect these two metrics to stress-test company performance. For example, when assessing how a company might handle an economic downturn or a supply chain disruption, test the sensitivity of EV and EBITDA to key changes.
For example, a 10% uptick in working capital can lead to a higher EV (due to more cash being tied up in operations and thus less cash on hand) for the same level of EBITDA, thereby worsening the EV/EBITDA ratio and signaling higher capital intensity that investors may penalize.
In contrast, cutting operating costs boosts EBITDA more directly and can quickly improve the EV/EBITDA ratio, a potential green flag for operational turnaround plays.
Changes in capital expenditure can also shift the balance. Reducing investments may create short-term gains in EBITDA but could affect long-term earning potential.
By modeling these changes, we can evaluate how vulnerable or resilient a business is to shifts in inventory management, equipment renewal, or shifts in receivables and payables. This turns static financials into forward-looking insights.
The EV/EBITDA Multiple
The EV/EBITDA ratio offers a clean view of how much a buyer is paying for each unit of operating earnings, creating a benchmark for valuation and key financial metrics comparison.
Calculating and Interpreting EV/EBITDA
To compute this ratio, divide Enterprise Value by EBITDA. A lower multiple can be a sign of potential undervaluation, assuming the business fundamentals hold up.
If a business has an EV of $100 million and EBITDA of $20 million, its EV/EBITDA is 5x.
Common ranges by sector include:
- Tech companies: 10–15x
- Manufacturers: 6–8x
- Retailers: 5–7x
These are ballpark figures; actual multiples can vary widely based on growth prospects, risk profiles, and market sentiment.
For example, a logistics company with a 6x multiple might seem undervalued, until you factor in fuel price volatility and fleet maintenance costs. If you’re screening for acquisition targets in fragmented industries like manufacturing, this ratio helps you rank companies based on relative operational return vs. total acquisition cost.
Advantages of EV/EBITDA Over Other Multiples
Unlike the P/E ratio, EV/EBITDA includes debt and is not skewed by tax rates or accounting practices. This makes both EV and EBITDA more stable inputs in a business valuation analysis.
EV/EBITDA is more effective when comparing businesses with different capital mixes or international tax rules. In capital-heavy sectors, where depreciation dramatically affects net income, EV/EBITDA gives a more consistent view of operating performance. Take ExxonMobil, for example. Its large capex and depreciation significantly suppress net income, but EBITDA gives a clearer look at operational strength, especially when oil prices surge.
It’s also useful for comparing acquisitions, since it reflects the actual price a buyer would pay and the operational returns they can expect. When AT&T acquired Time Warner, analysts leaned heavily on EV/EBITDA to evaluate the deal, given AT&T’s massive debt and the capital-intensive nature of both businesses.
When weighing a power plant acquisition versus a data center investment, for instance, the EV/EBITDA multiple adjusts for heavy debt loads and capital intensity, giving you a truer baseline for ROI projections.
Limitations and Pitfalls
While powerful for operational key financial metrics comparisons, the EV/EBITDA multiple also has its limitations and pitfalls that can distort a company’s true financial health and valuation.
EBITDA doesn’t show how much companies must reinvest in capital equipment, which can be a blind spot. In sectors like telecom or heavy industrials where billions go into infrastructure upgrades, a company may look efficient while bleeding cash behind the scenes.
It also ignores working capital needs, so businesses with big swings in receivables or inventory could look better on paper than they are in reality. Consider a retail chain with seasonal inventory buildups. It might show strong EBITDA in Q4, but the picture changes when you adjust for cash tied up in unsold stock.
Differences in expected growth complicate comparisons too. A high-growth business may deserve a higher multiple, but this isn’t always reflected in a simple EV/EBITDA calculation. If you’re choosing between two SaaS firms, one scaling at 40% annually, the other at 10%, a raw multiple won’t reveal who’s truly delivering long-term value.
Finally, geographic differences, sector-specific risks, and economic cycles all influence what a “fair” multiple looks like, so context is everything. When making valuation calls, always anchor the multiple to the story behind the numbers.
EV vs. EBITDA: Understanding the Value Behind the Numbers
The EV/EBITDA ratio offers a clearer, more grounded way to judge a company’s true worth. While revenue growth or the P/E ratio might only skim the surface, EV/EBITDA goes deeper. It incorporates both a firm’s capital structure and its operating performance, enabling more meaningful comparisons across industries and business models.
Although EV/EBITDA is not without its limitations, especially in capital-intensive sectors or firms with volatile working capital, it remains one of the most widely used ratios in corporate finance for a reason: it helps uncover details that matter.
If you want to get deeper, faster insights into valuation without drowning in spreadsheets, Daloopa can help. We offer automated data extraction and updating so you can move from raw numbers to confident decisions quickly and accurately. Find a plan that suits you today to get started.


